Unveiling the Secrets of Single Candlestick Patterns to Boost Your Stock Market Technical Analysis.
Table of Contents
Introduction:
Welcome to the exciting world of single candlestick patterns, where a single candle holds the potential to unlock valuable information about market dynamics and predict future price movements. By understanding and leveraging these patterns, you can enhance your stock market technical analysis and make more informed trading decisions.
In this comprehensive guide, we will walk you through the intricacies of single candlestick patterns. From the basic building blocks to advanced strategies, we’ll equip you with the knowledge and tools to decipher these patterns with ease. So, fasten your seatbelts and embark on this enlightening journey!
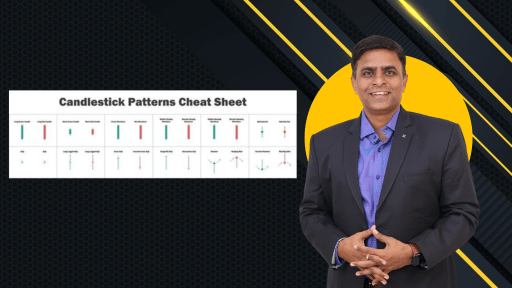
I. The Power of Single Candlestick Patterns
Single candlestick patterns are simple yet powerful tools that enable traders to gauge market sentiment and anticipate potential reversals or continuations in price trends. These patterns are formed by the open, high, low, and close prices of a single trading session, offering valuable insights into the battle between buyers and sellers.
- Bullish Single Candlestick Patterns
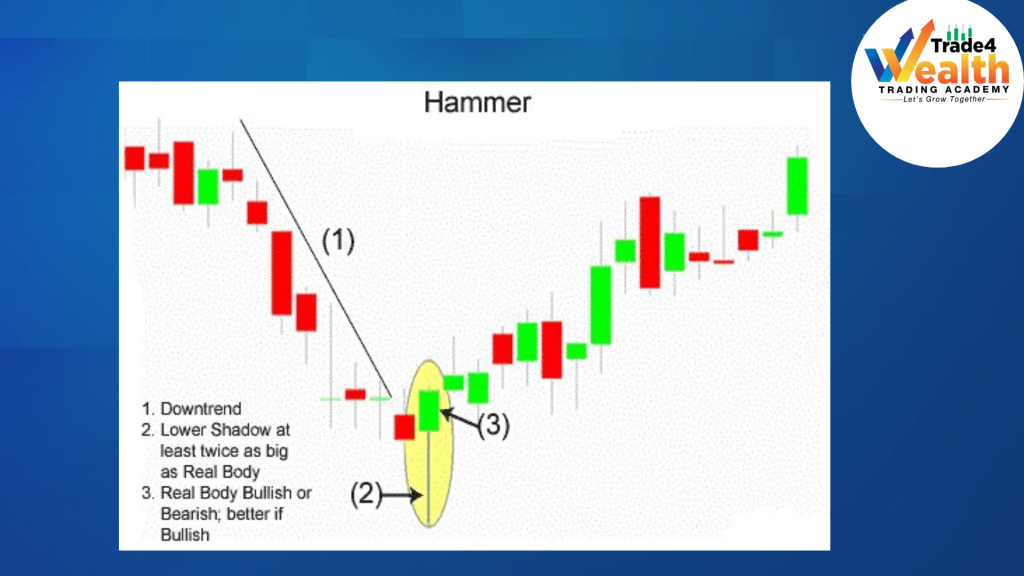
- Hammer: This pattern resembles a hammer, characterized by a small body at the upper end of the trading range and a long lower shadow. It indicates a potential trend reversal from bearish to bullish, signaling that buyers are gaining strength.
Citation: [1] (source: https://www.investopedia.com/terms/h/hammer.asp)
- Bullish Engulfing: The bullish engulfing pattern occurs when a small bearish candle is followed by a larger bullish candle that completely engulfs the previous candle. It suggests a shift in market sentiment from bearish to bullish, indicating potential buying opportunities.
Citation: [2] (source: https://www.investopedia.com/terms/b/bullishengulfingpattern.asp)

- Bearish Single Candlestick Patterns
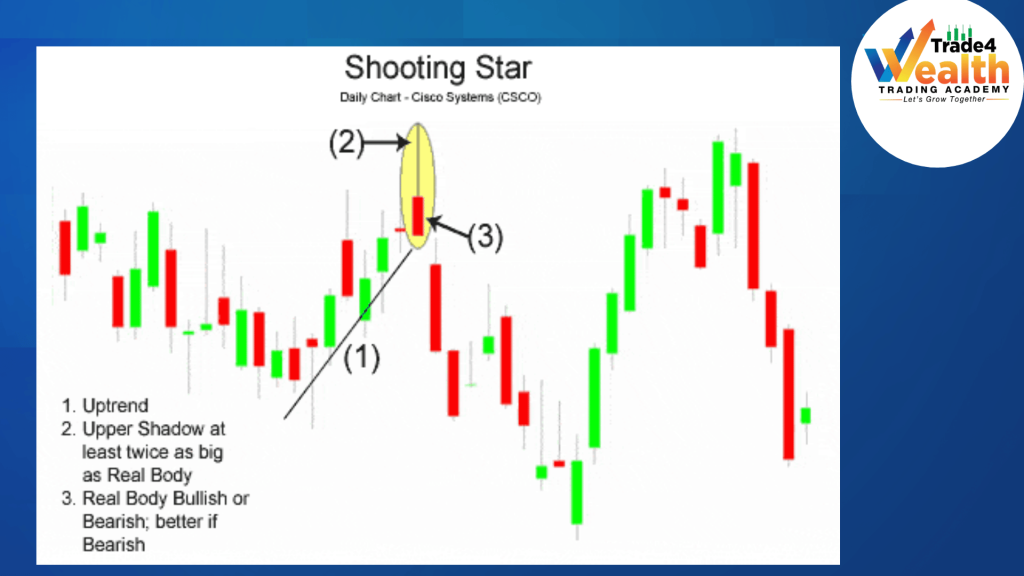
- Shooting Star: This pattern features a small body at the lower end of the trading range and a long upper shadow, resembling a shooting star. It suggests a potential trend reversal from bullish to bearish, indicating that sellers are gaining momentum.
Citation: [3] (source: https://www.investopedia.com/terms/s/shootingstar.asp)
- Bearish Engulfing: The bearish engulfing pattern occurs when a small bullish candle is followed by a larger bearish candle that engulfs the previous candle. It implies a shift in market sentiment from bullish to bearish, signaling potential selling opportunities.
Citation: [4] (source: https://www.investopedia.com/terms/b/bearishengulfingpattern.asp)

II. Incorporating Single Candlestick Patterns into Your Analysis
Now that we’ve explored some key single candlestick patterns, it’s time to discuss how you can effectively integrate them into your stock market analysis.
- Confirmation with Volume: While single candlestick patterns provide valuable
insights, it’s crucial to confirm their signals with volume. Higher volume during pattern formations enhances their reliability and strengthens your analysis.
- Support and Resistance Levels: Consider the presence of support and resistance levels when analyzing single candlestick patterns. If a pattern aligns with a significant support or resistance level, it increases the probability of a successful trade.

III. Frequently Asked Questions (FAQs)
- Can single candlestick patterns guarantee profitable trades? While single candlestick patterns offer valuable insights into market sentiment, they should not be considered foolproof indicators. It’s essential to combine them with other technical analysis tools and risk management strategies to make informed trading decisions.
- How can I practice identifying single candlestick patterns? You can enhance your skills by studying historical price charts and analyzing the formation of candlestick patterns. Additionally, numerous online resources offer interactive quizzes and educational materials to help you sharpen your pattern recognition abilities.
IV. Conclusion
In conclusion, single candlestick patterns serve as powerful tools in stock market technical analysis, providing valuable information about market sentiment and potential price movements. By mastering these patterns, you can elevate your trading strategies and gain a competitive edge.
Now that you have a solid foundation in single candlestick patterns, take the time to practice and refine your skills. Remember, consistency and continuous learning are key to becoming a proficient technical analyst. Embrace the fascinating world of single candlestick patterns, and let them guide you towards successful trading endeavors.
Previous Article: ideaForge Technology IPO: A Revolutionary Leap in the Drone Industry
Disclaimer:
The information provided in this blog post is for educational and informational purposes only. It should not be construed as financial advice or a recommendation to buy or sell any securities. Always do your own research and consult with a qualified financial advisor before making investment decisions.