Table of Contents
What is the Inverse Head and Shoulders Pattern?
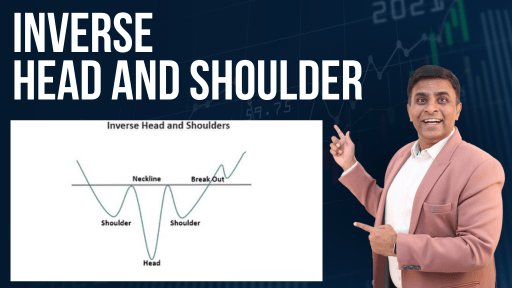
The Inverse Head and Shoulders is a classic technical analysis pattern that often occurs in price charts. It forms after a downtrend and consists of three main parts: a left shoulder, a head, and a right shoulder. Picture this: the left shoulder is like the first hill, the head is the deepest valley, and the right shoulder resembles the second hill on a roller coaster ride.
This pattern is called “Inverse” because it is essentially the opposite of the regular Head and Shoulders pattern, which indicates a bearish trend reversal. The Inverse Head and Shoulders, on the other hand, suggests a potential bullish trend reversal. It signifies a shift in market sentiment from bearish to bullish.
Identifying the Inverse Head and Shoulders Pattern
Wondering how to spot this pattern on your charts? Keep your eyes peeled for these key characteristics:
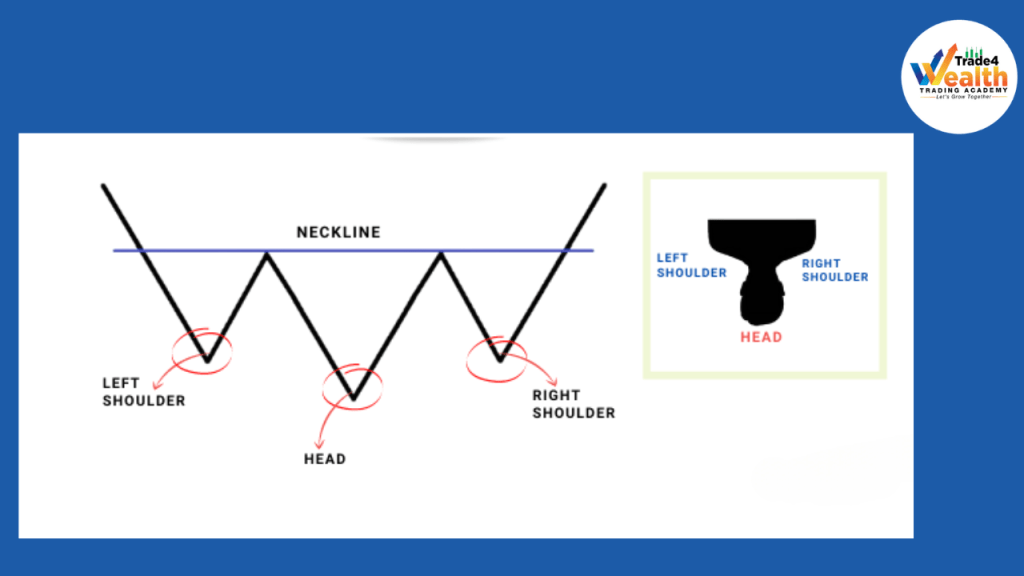
- Distinctive Shape: The Inverse Head and Shoulders pattern typically forms with three troughs, where the middle trough (the head) is lower than the two shoulders. The troughs are connected by a trendline, often referred to as the “neckline.”
- Volume Patterns: Traders should pay attention to the trading volumes during the formation of the pattern. Typically, the volume decreases as the pattern develops and then rises sharply when the price breaks above the neckline.
- Symmetry: The left shoulder and the right shoulder should have a similar distance from the head, creating a symmetrical appearance.
Once you have identified the Inverse Head and Shoulders pattern, it’s time to think about potential entry and exit points for your trades.
KeyPoints
- Definition: The Inverse Head and Shoulders, also known as “head and shoulders bottom,” is an inverted version of the standard head and shoulders pattern. It is used to predict reversals in downtrends.
- Formation: The pattern is identified when the price falls to a trough and then rises, falls below the former trough and rises again, and finally falls again but not as far as the second trough. Once the final trough is formed, the price heads upward towards the resistance found near the top of the previous troughs.
- Signal of Bull Market: Completion of the Inverse Head and Shoulders pattern signals a potential bull market. Investors usually enter into a long position when the price rises above the resistance of the neckline.
- Components: The Inverse Head and Shoulders pattern consists of three troughs or dips. The first and third troughs are considered shoulders, and the second trough forms the head.
- Profit Target: Traders can ascertain a suitable profit target by measuring the distance between the bottom of the head and the pattern’s neckline and projecting that same distance upward from the neckline.
- Entry Points: Aggressive traders can place a buy-stop order just above the neckline to catch the first breakout and upward momentum. Conservative traders may wait for a price close above the neckline for confirmation or place a limit order just below the broken neckline to execute on a possible retrace.
- Difference from Head and Shoulders: The Inverse Head and Shoulders predicts reversals in downtrends, while the standard Head and Shoulders pattern predicts reversals in uptrends.
- Limitations: Like all charting patterns, the Inverse Head and Shoulders has its limitations, and traders need to be cautious about false breakouts and missed opportunities.
- Reliability: The Inverse Head and Shoulders pattern is considered one of the most reliable trend reversal patterns used in technical analysis.
- Trading Strategy: The most common entry point is a breakout of the neckline, with a stop placed below (for market bottom) or above (for market top) the right shoulder. The profit target is calculated based on the pattern’s distance added or subtracted from the breakout price.
Trading Strategies
Now that you grasp the essence of the Inverse Head and Shoulders pattern, it’s time to explore some trading strategies that can be implemented based on this pattern.
- Entry Point: As a trader, your goal is to enter the market at an opportune moment to maximize your profits. The ideal entry point for an Inverse Head and Shoulders pattern is when the price breaks above the neckline. This breakout is a strong signal of the potential bullish reversal. However, be cautious and wait for the breakout confirmation with a significant increase in trading volume.
- Stop Loss Placement: To manage risk effectively, consider placing your stop loss just below the neckline. If the price retraces and breaks back below the neckline, it could invalidate the pattern, and you wouldn’t want to be caught on the wrong side of the trade.
- Target Price Projection: To estimate the potential price target of the uptrend, measure the distance from the head to the neckline. Then, extend that distance from the breakout point (the neckline) in the direction of the new uptrend. This projected distance gives you a rough idea of how far the price might move.
Frequently Asked Questions (FAQs)
Q: Is the Inverse Head and Shoulders pattern always reliable for predicting bullish trends?
A: While the Inverse Head and Shoulders pattern can be a strong indicator of a potential bullish trend reversal, it is not foolproof. Like any technical analysis pattern, it is essential to consider other factors and use it in conjunction with other indicators for confirmation.
Q: Can the Inverse Head and Shoulders pattern occur in different timeframes?
A: Absolutely! The Inverse Head and Shoulders pattern can appear in various timeframes, from intraday charts to weekly or monthly charts. The larger the timeframe, the more significant the potential trend reversal may be.
Q: Are there any other patterns similar to the Inverse Head and Shoulders?
A: Yes, the Inverse Head and Shoulders is just one of many chart patterns in technical analysis. Some other patterns include the Regular Head and Shoulders, Double Tops, and Triple Bottoms.
Wrapping Up: Embrace the Power of the Inverse Head and Shoulders
To sum it all up, the Inverse Head and Shoulders pattern is a valuable tool for traders looking to identify potential trend reversals. It indicates a shift in market sentiment from bearish to bullish and offers strategic entry and exit points for traders. Remember to combine this pattern with other technical analysis tools for confirmation and always use risk management to protect your trading capital.
So, the next time you spot those two hills and a valley on your price charts, get ready for a potential roller coaster ride in the markets! The Inverse Head and Shoulders pattern could be your ticket to profitable trading opportunities.
Disclaimer:
The information provided in this blog post is for educational and informational purposes only. It should not be construed as financial advice or a recommendation to buy or sell any securities. Always do your own research and consult with a qualified financial advisor before making investment decisions.
Also Read: Mastering the Price Action Strategy: Unveiling the Secrets of Successful Stock Market Trading
External Resources : Inverse Head And Shoulder