Table of Contents
Introduction: Embracing the Hammer Candlestick’s Mystique
Enter the hammer candlestick, a potential tool in the arsenal of price action traders. If you’ve ever wondered how to decipher the hidden language of price movements, this guide is your Rosetta Stone.
KeyPoints
- Hammer Candlestick Defined: A hammer is a candlestick pattern that signifies a security trading lower than its opening, then rallying to close near the opening price.

- Visual Descriptor: The hammer pattern creates a candlestick resembling a hammer, with a long lower shadow at least twice the size of the real body.
- Bullish Potential: Hammers usually emerge after a price decline, indicating potential trend reversals and shifts in market sentiment.
- Buyer Triumph: During the trading period, sellers push the price down, but buyers rally the price back up near the opening by market close.
- Confirmation is Key: To validate a hammer, the following candle must close above the hammer’s previous closing price, confirming the potential reversal.
- Context Matters: Hammers are often seen in the context of a downtrend, suggesting an attempt to find a bottom and a potential reversal.
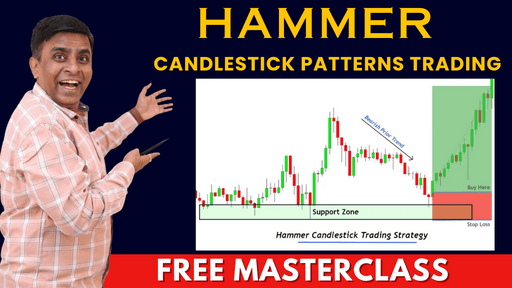
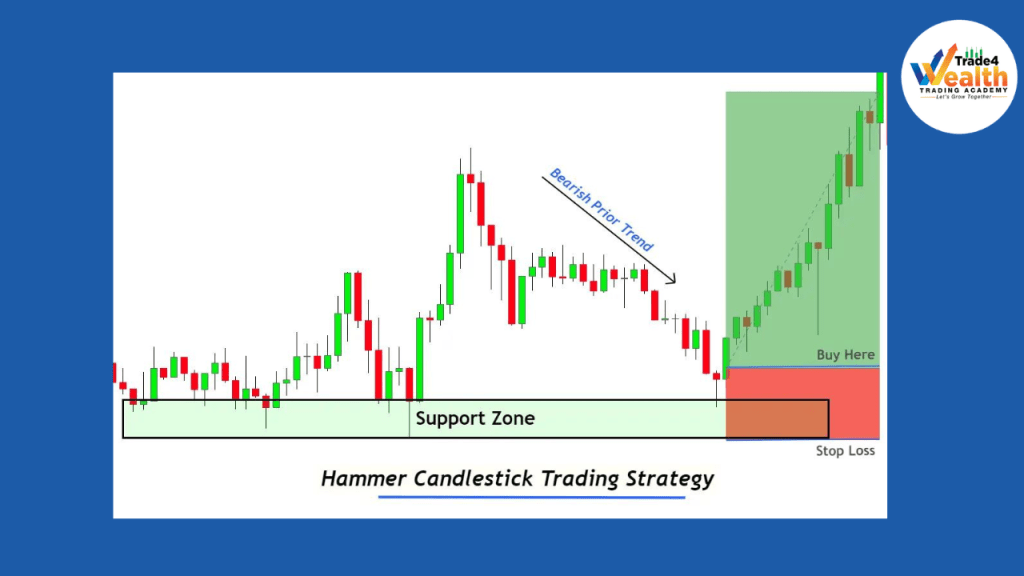
- Trading Strategy: Traders can enter long positions or exit short ones during or after the confirmation candle, placing stop losses strategically.
- Combining Signals: Hammers are more effective when used in conjunction with other technical indicators or trend analysis.
- Psychological Insights: A hammer reflects bullish investors taking positions, hinting at a potential reversal in the downward price movement.
- Profit Management: Protecting trades with stop losses and considering exit points based on resistance levels enhances profit potential.
What is the Hammer Candlestick, Anyway?
Imagine a candlestick that resembles a humble hammer – a small rectangular body with a long lower shadow, mimicking the handle, and a tiny or non-existent upper shadow. This intriguing formation holds a tale of its own, signaling potential trend reversals and shifts in market sentiment.
Key Characteristics:
- Small Body, Long Lower Shadow: The hammer’s body is confined to the upper portion of the overall candlestick, while the lower shadow extends below. This unique shape captures the essence of a hammer, with its head and handle.
- Bullish Potential: A hammer found at the end of a downtrend is akin to a beacon of hope. It suggests that despite the prevailing selling pressure, buyers managed to push the price up, closing near the high. This can signal a potential reversal in the making.

Decoding the Hammer’s Message: What It Signifies
Here’s where things get exciting. The hammer candlestick isn’t just a fancy name; it’s a powerful communicator of market sentiment.
Hammer as a Reversal Signal
Hey, I’ve got a secret for you – the hammer isn’t just any old candlestick. It’s like a magician’s wand, waving its spellbinding potential to flip the script on a downtrend. When you spot a hammer after a prolonged downtrend, it’s like the market is winking and whispering, “A change might be afoot, my friend.”
The Art of Confirmation: Factors to Consider
Hold your horses, cowboy! Before you ride into the sunset of profits, remember that a single hammer doesn’t guarantee a trend reversal. Confirmation in the form of the following factors:
- Volume: Like a chorus of voices backing up a soloist, increasing volume can validate the hammer’s message. It shows that a substantial number of traders are on board with the potential reversal.
- Follow-Through: So, the hammer lit the spark. What next? The subsequent candlesticks are the story’s chapters. Look for bullish candlesticks that continue the upward momentum after the hammer.
Hammer Time: How to Make the Most of This Pattern
Alright, partner, let’s roll up our sleeves and dive into action. Here’s a step-by-step guide on how to leverage the hammer candlestick pattern for all it’s worth.
Step 1: Identify the Hammer
The first order of business is to spot the hammer in the wild. Fire up your charting software and keep an eagle eye out for that distinctive shape – small body, extended lower shadow, and minimal upper shadow.
Step 2: Context is King
Remember, context is everything. Just like you wouldn’t ride a bull in a china shop, you wouldn’t trade solely based on a hammer without considering its surroundings. Is it at the end of a downtrend? Is there supporting volume? The more pieces that fit into the puzzle, the clearer the picture becomes.
FAQs: Hammering Out Your Queries
Q1: Can the hammer appear in an uptrend?
A: Absolutely! While it’s more commonly associated with reversals in a downtrend, a hammer can also act as a continuation pattern within an uptrend.
Q2: How long should the lower shadow be?
A: There’s no fixed rule, but generally, the longer the lower shadow, the stronger the potential reversal signal.
Q3: Can I solely rely on the hammer for trading decisions?
A: The hammer is a trusty sidekick, but like Batman needs Robin, it’s better used in conjunction with other tools and indicators.
Riding into the Sunset: The Conclusion Unveiled
And there you have it, partner! The hammer candlestick pattern is your faithful steed in the wild frontier of stock trading. Armed with this knowledge, you’re now equipped to decipher its language, read its stories, and make informed decisions that could tip the scales in your favor. So saddle up, keep learning, and may your trades be as bullish as a stampede.
Disclaimer:
The information provided in this blog post is for educational and informational purposes only. It should not be construed as financial advice or a recommendation to buy or sell any securities. Always do your own research and consult with a qualified financial advisor before making investment decisions.
Also Read : Top 5 Best Indicators
External Sources : Hammer